TechGrovy

Product Analytics for Data-Driven Teams

The only product analytics platform that connects directly to your data warehouse to provide actionable insights across the entire customer journey — without SQL or writing a single line of code.
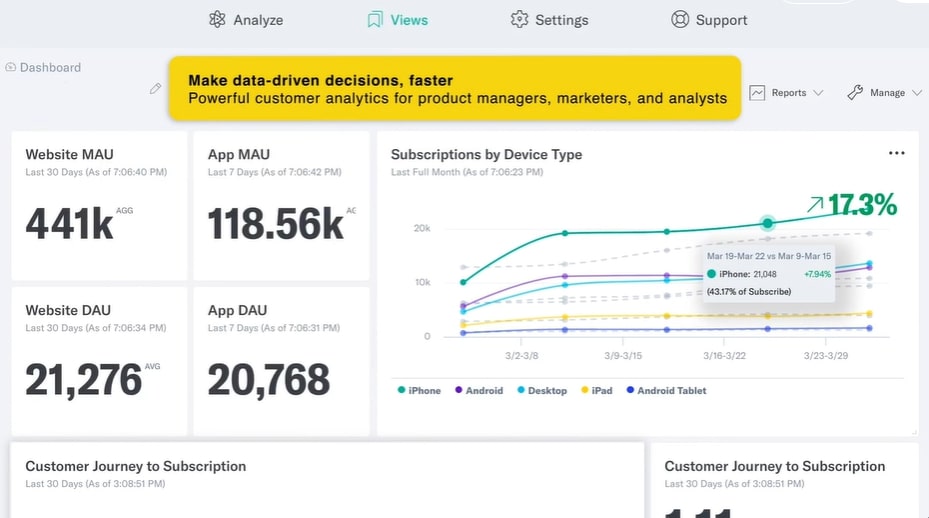
Banner

TechGrovy is an analytics platform designed for data-driven teams. It uniquely connects directly to your data warehouse, eliminating the need for SQL or coding, providing actionable insights throughout the customer journey. Technologies typically used in such software include seamless integration with various data sources, customer analytics, journey mapping, cohort analysis, and segmentation tools. With features like Multipath Funnel, Customer Journeys, Cohort Analysis, and Segmentation, TechGrovy aims to empower users to optimize experiences, understand user behavior, and make informed, data-driven decisions for improved product performance. The platform is centered on connecting data, knowing customers without SQL knowledge, and optimizing user experiences through visualizations and in-depth analyses.

Core Benefits

dg

Connect Your Data

Integrate with any existing data source, including your data warehouse/lake, CDP, or directly from your website or mobile app.

dg

Know Your Customer

Optimize acquisition, visualize customer journeys, and maximize retention without knowing SQL.

dg

Optimiza your Experience

Identify how users engage and where they drop off and make data-driven decisions to improve feature adoption and eliminate points of friction.

Product Features

Awesome Image
Multipath Funnel

Path to Conversion Report

Visualize and optimize conversion and retention with TechGrovy's unique Multipath Funnel. Get granular with your customer journey using TechGrovy’s Multipath Funnel.

  • Measure purchase journey performance across various customer profiles by using breakouts, or optional steps.
  • Measure how new marketing campaigns, or new features affect conversion rates over time.
  • Analyze multiple customer journeys in one visualization to identify the optimal path to conversion.
Customer Journeys

Customer Analytics & Journey Maps

Discover the most common paths customers take through your product and towards conversion & Visualize the complete Customer Journey.

  • Discover the paths that lead to conversion
  • Answer common questions like what users do after they create an account or log on to your product
  • Identify the path users most frequently take through your product to inform your product roadmap and improve customer experience
  • Understand new user behavior by mapping their Journeys
  • Build Funnels and Cohorts based on an in-depth analysis of how customers move through your product
Awesome Image
Awesome Image
Cohort Analysis

Customer & Retention Cohort Analysis, SQL Analysis

Build behavioral cohorts that pinpoint the features and campaigns that most engage and retain customers.

  • Implement the right product improvements by analyzing customer actions over time.
  • Configure your revenue mapping and select Revenue as a Target Behavior to determine how different behavioral cohorts affect your bottom line.
  • Slice and dice your cohort with time or property based breakouts.
  • Determine behavioral characteristics that drive customer retention by selecting Recurring Behavior.
  • Analyze customer behavior in the short and long term by toggling your date range and intervals.
Segmentation

Segmentation Tool

Ask, answer, and act on the most important questions about your customers and their behavior.

Total Count of Events and Users who Performed

  • Toggle your Segmentation mode in order to compare event level data with user level data.
  • Analyze the total number of times a particular event was performed.
  • Identify the number of users who performed a particular event.
  • Use custom calculations to add, subtract, multiply or divide 2 query rows. Measure event counts per user, percentages towards a total sum, and more!
  • Use the Trends feature to compare analysis to the previous interval. Compare absolute event counts or percent change.

Awesome Image
Awesome Image

Fine Tune your Insights

Modify your analysis with TechGrovy’s wide selection of visualization settings.

  • Identify high-level event aggregates and patterns, and then get granular in query building by adding unlimited filters, breakouts, or event chains.
  • Use the Trends feature to compare analysis to the previous interval. Compare absolute event counts or percent change.
  • Choose the best way to display and interact with your data. TechGrovy offers visualizations such as Line, Bar, Table, Metrics, Map and much more!